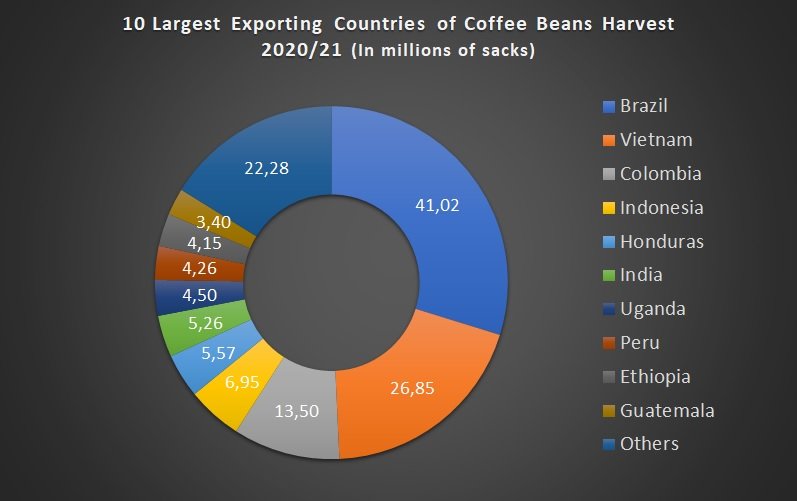
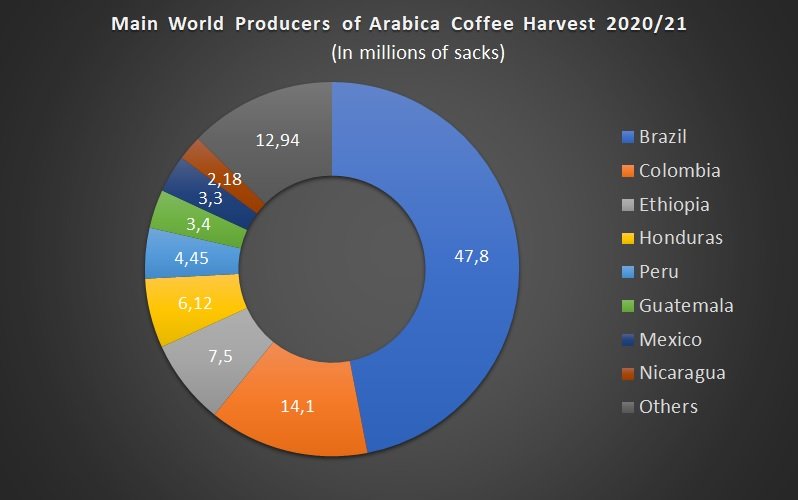
The International Coffee Organization (OIC) differentiates four basic qualities: unwashed Arabic, soft Colombian; others soft or central and robust. The distribution of the market is relatively proportional between these groups. The largest share corresponds to unwashed Arabs, which contribute 28% of world exports. Central and robust coffees each represent 26% of the market and soft Colombians 19%. Although a large number of countries contribute to supply, the eight main producers account for 68% of world exports. The concentration is higher in the various groupings. Thus, Brazil and Colombia account for 92% and 79% of the world production of unwashed and soft Colombian Arabs, respectively, thus exercising a virtual monopoly of such qualities and a great control over the global market.
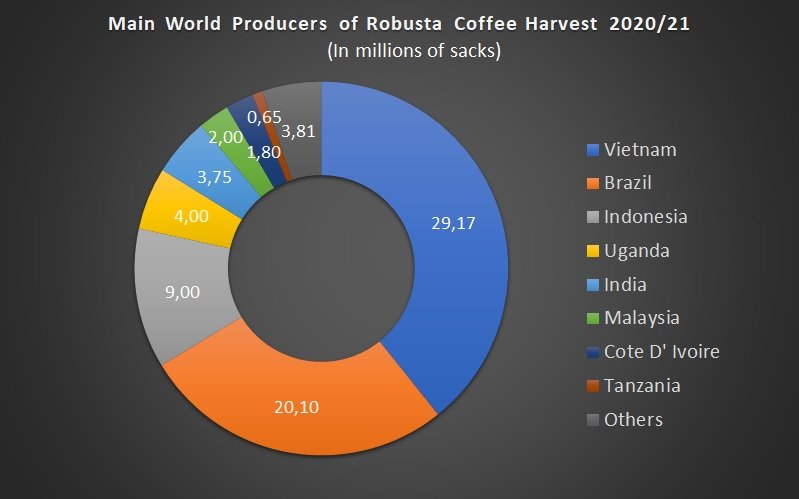
The concentration is somewhat lower in the case of the robust ones, where the three main producers (Côte d’Ivoire, Indonesia and Uganda) concentrate in any case 65% of world sales. Finally, the most competitive market is central coffee, where the three major producers (El Salvador, Mexico and Guatemala) represent 48% of the supply in the world market, but there is a broad set of products in Central America, the Caribbean and Asia.
Global Coffee Production
World coffee production has maintained its upward trend in the long term, standing at the end of 2017 in 158.6 million bags of 60 kg, despite having a negative variation of 0.3% compared to 2016 , has increased by 70% since 1990, according to figures from the International Coffee Organization (ICO), for which, production has been growing significantly in recent decades, and according to the Department of Agriculture of the United States (USDA ), the total production for this year 2018, will be placed in record figures, since it could possibly reach 171 million bags, this increase is already evident with the production registered in the first half of this year by the countries of Brazil and Indonesia, which obtained a harvest of 60 million bags and 11.5 million bags, respectively, with a positive variation with respect to the previous period of 17.6% and 5.5%, according to the data reported by the ICO, which it’s It is very relevant for the market, because these two countries are part of the group of largest coffee producers worldwide, as are Vietnam and Colombia, and between these four countries they cover around 66% of the total global coffee production .
Coffee varieties by geographical area
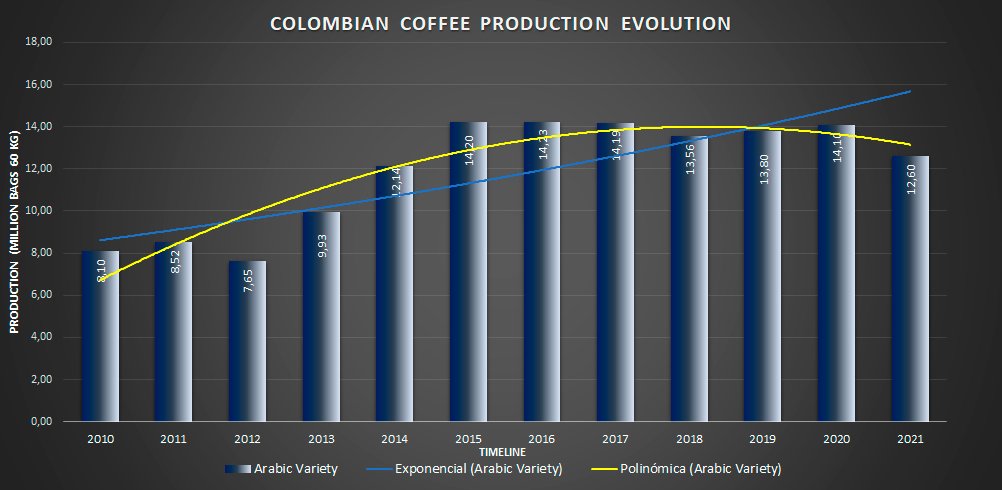
Colombian Coffee
Coffee, is one of the main export products of Colombia, and plays a very important role in the national economy, also, internationally, the country is positioned as one of the largest producers of grain worldwide, the same Thus, the variety of soft coffee (Arabic) produced in Colombia, is very desirable, especially in the markets of the United States, European countries and Japan, therefore, its influence on the market is quite significant.
Likewise, coffee production by Colombia was placed in 2017 at 14 million bags, decreasing by 4.3% compared to 2016, however, the country continues to be the third largest producer of grain worldwide. , after Brazil and Vietnam.
The coffee harvest in Colombia for the first semester of the year 2018, reached 6.5 million bags, with an increase of 2.6% compared to the same period of 2017, according to the figures reported by the National Federation of Coffee Growers, increasing the possibilities that the production of this year exceeds between 2% and 5%, the 14 million bags of the previous year, generating a greater pressure to the market in relation to the offer.
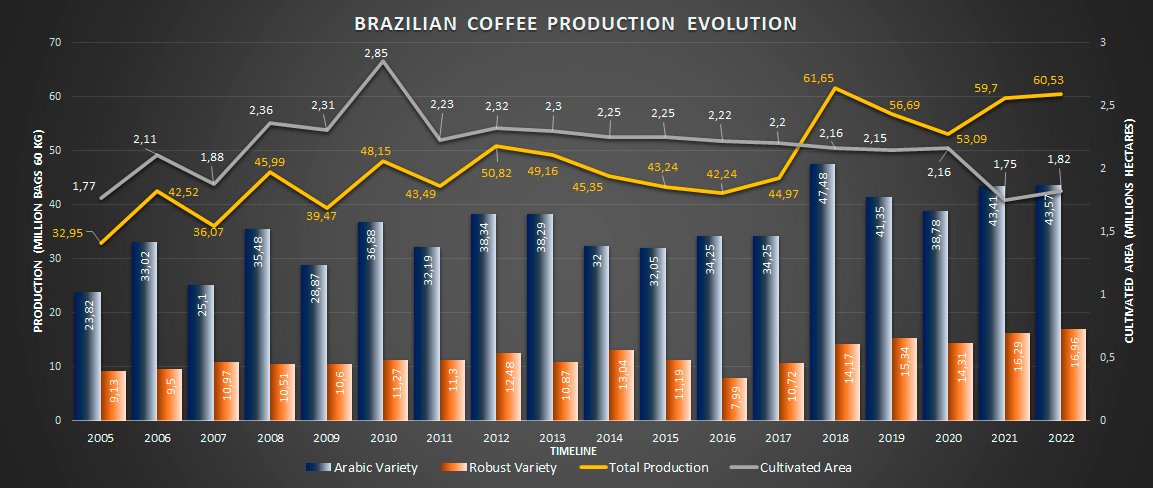
Brazilian Coffee
From January to the end of September 2022, Brazilian coffee exports totaled 28.748 million bags, showing a slight decrease of 3.9% compared to the 29.927 million registered in the first nine months of 2021. shipments yielding US$ 6.730 billion so far, an amount that represents significant gains of 60.4% compared to the US$ 4.197 billion recorded between January and September last year. “Arabica coffee exports had the best performance in this nine-month interval of the last five years, helping to mitigate the drop in volume so far. The record in foreign exchange revenue in the aggregate of 2022 reflects the favorable exchange rate and the good level of the average price of the shipment, which increases 67% compared to 2021 and reaches US$ 234.12 per bag”. On the other hand, even with the occasional improvement in the scenario, the president of Cecafé, Günter Häusler, recalls that the bottlenecks in logistics remain challenging. “I never get tired of praising the work of the exporting companies, which, in the face of a reality far below normality in global maritime trade, with higher costs, lower availability of containers, congestion in North American and European ports, lack of bookings , cargo rollovers, among other adversities, continue to unfold and maintain Brazil as a loyal supplier of coffee in terms of volume, quality and sustainability, even with the increase in logistical obstacles in September”, he adds.
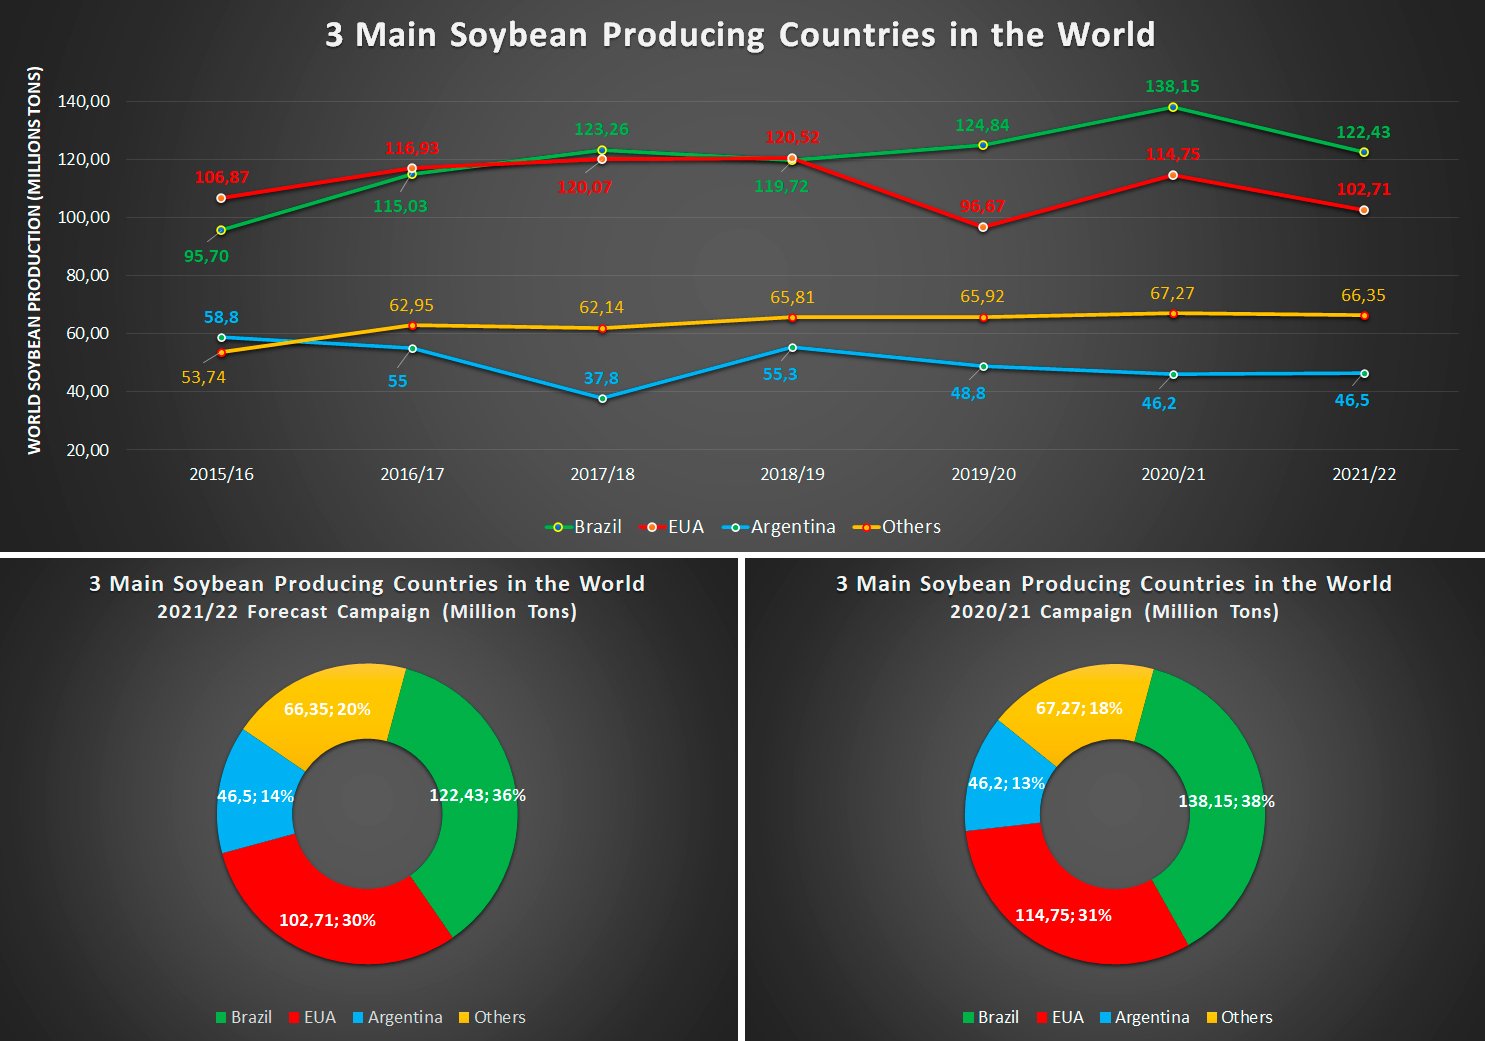
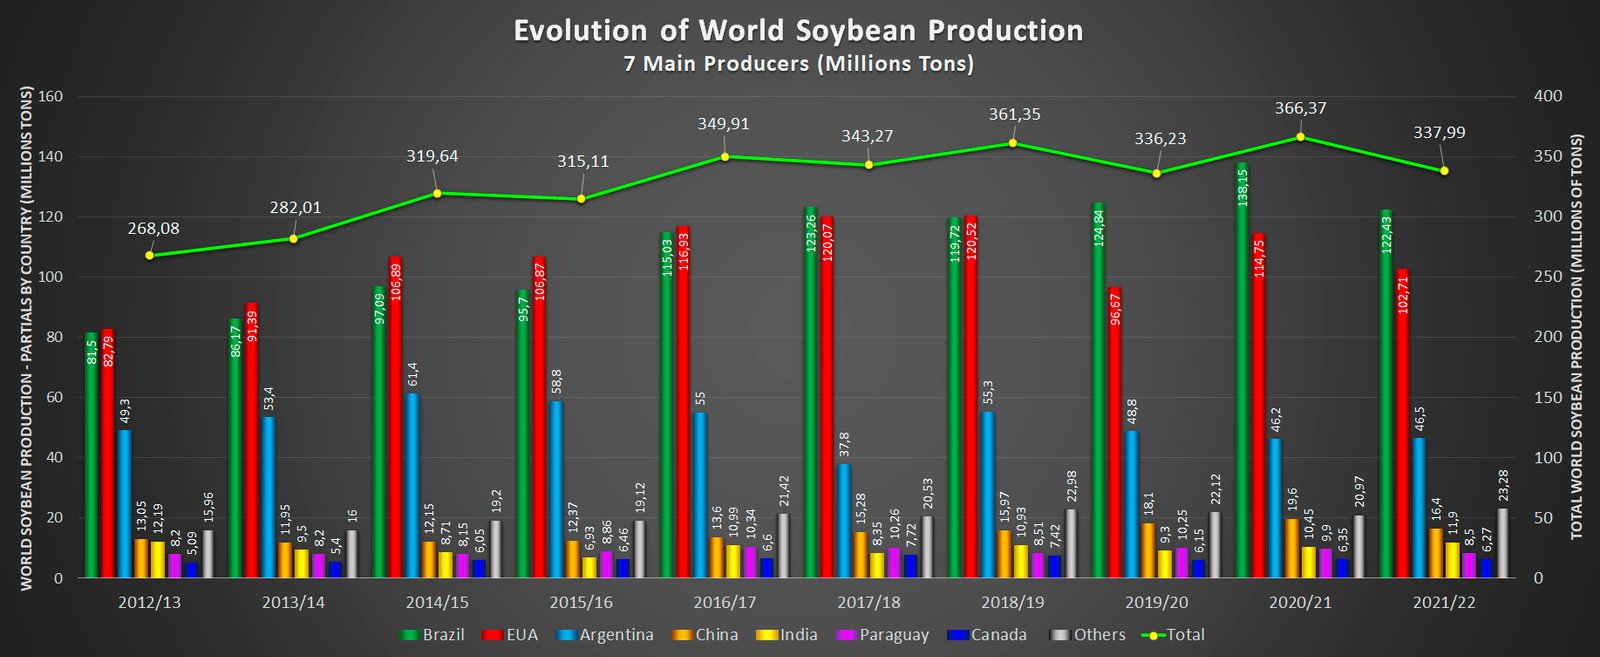
South America will produce more than half of the world's soybeans for the tenth consecutive campaign
Uneven evolution: in the last 20 cycles, Brazil doubled its soybean harvest, Paraguay doubled it and Argentina only increased it by 50%. In contrast to the regional trend, our country contracted the area devoted to oilseeds.
The 2021/22 campaign will once again have four South American countries among the 10 largest soybean producers in the world. The combined harvests of the southern cone will represent 55% of global soybean production, maintaining the share achieved last season. Two decades ago, South American production contributed 48% of the world’s beans, with a supply that was strongly concentrated in the United States (38% of world production). South America exceeded 50% participation in the 2007/08 campaign, when the relative weight of the United States fell to 33%. South American soybeans achieved the largest share of world supply during the 2019/20 cycle, contributing 57% of production. At that time, the result of the United States had decreased due to less planted area and lower yields.
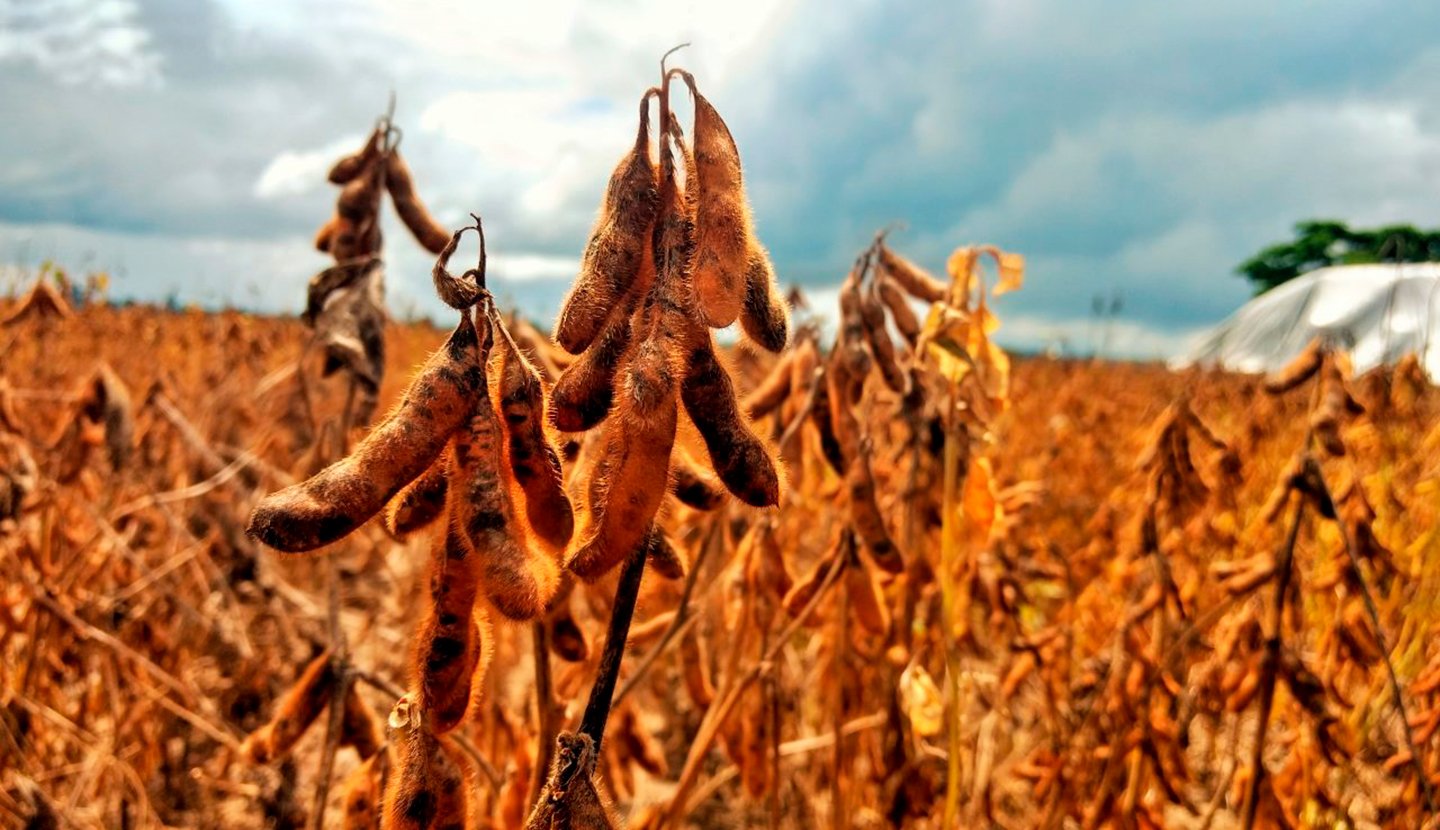
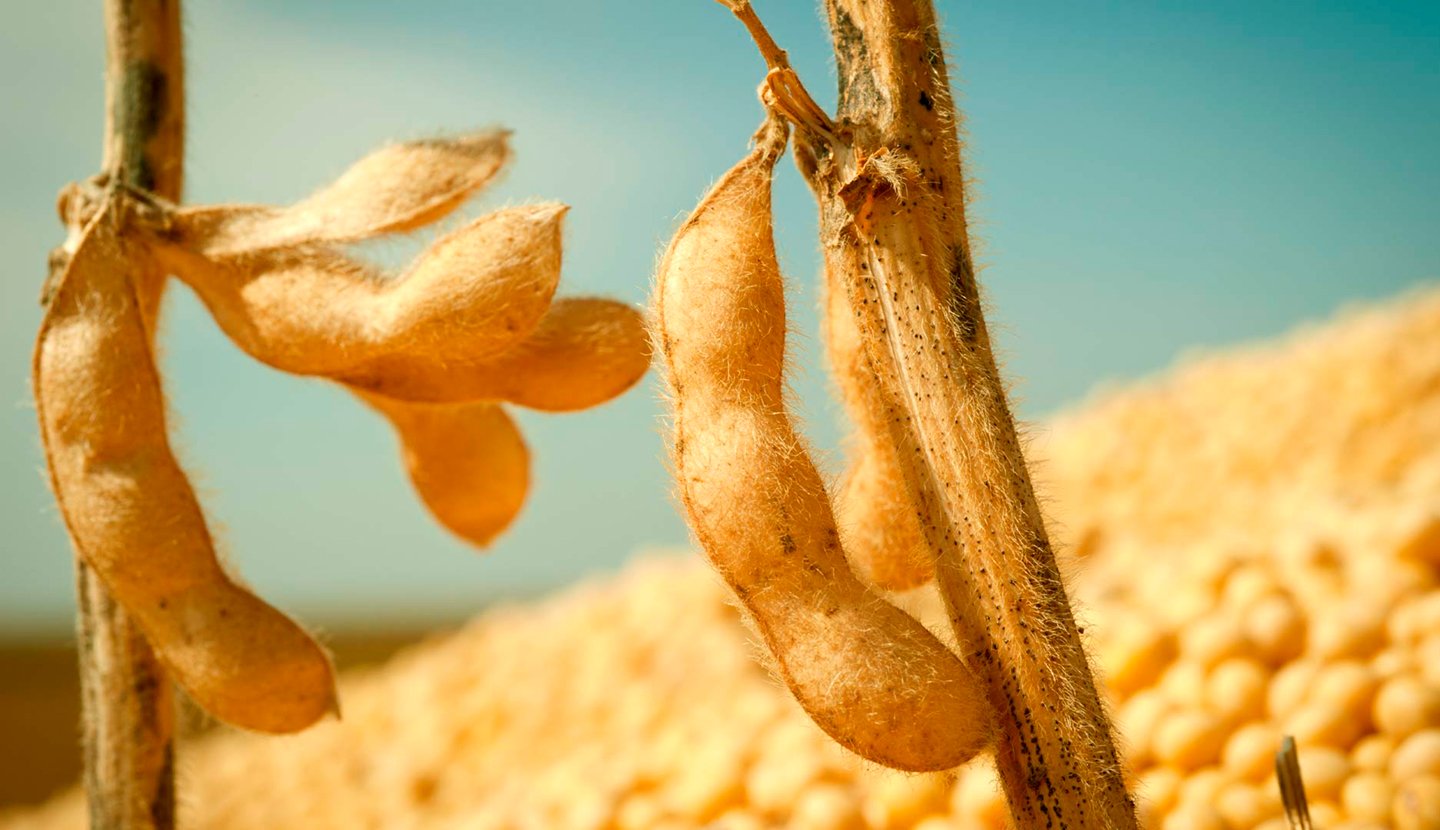
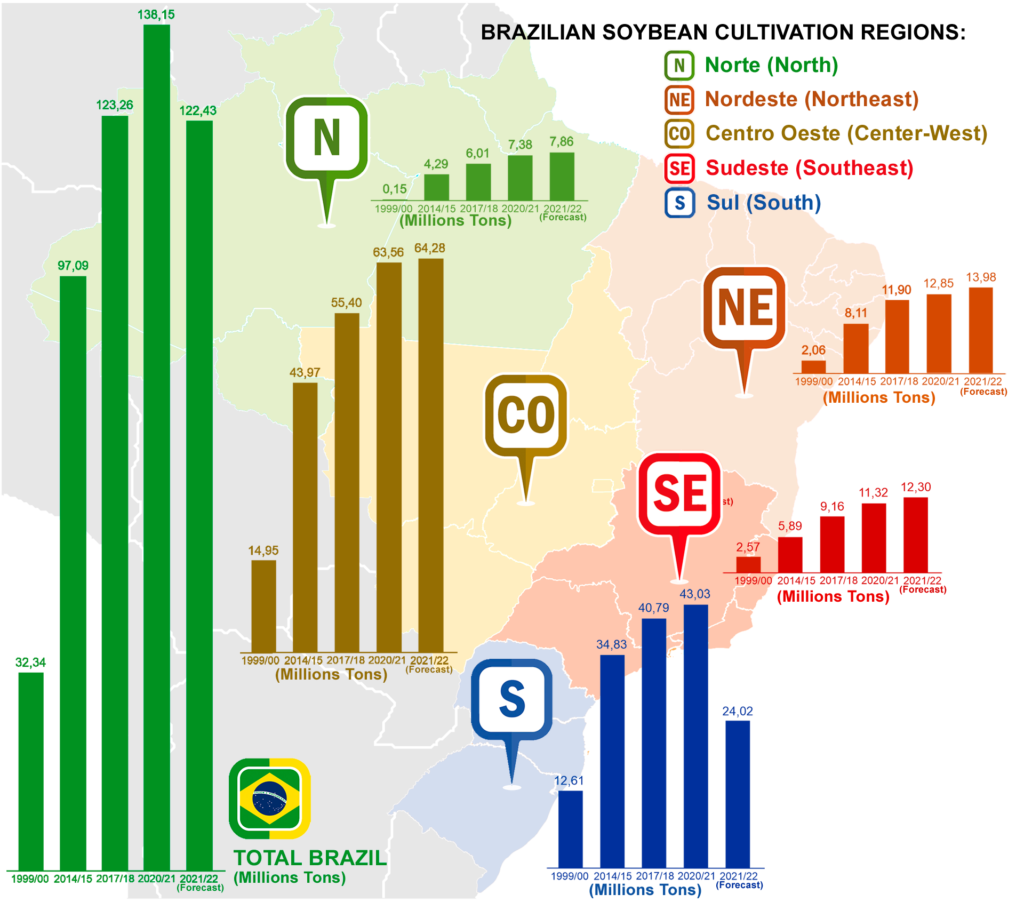
Brazil's main crop
Soybean is the largest crop in Brazil and the grain continues to be of great importance in the economic trade balance, being a powerful engine that encourages exports and expands the frontiers of Brazilian agribusiness worldwide.
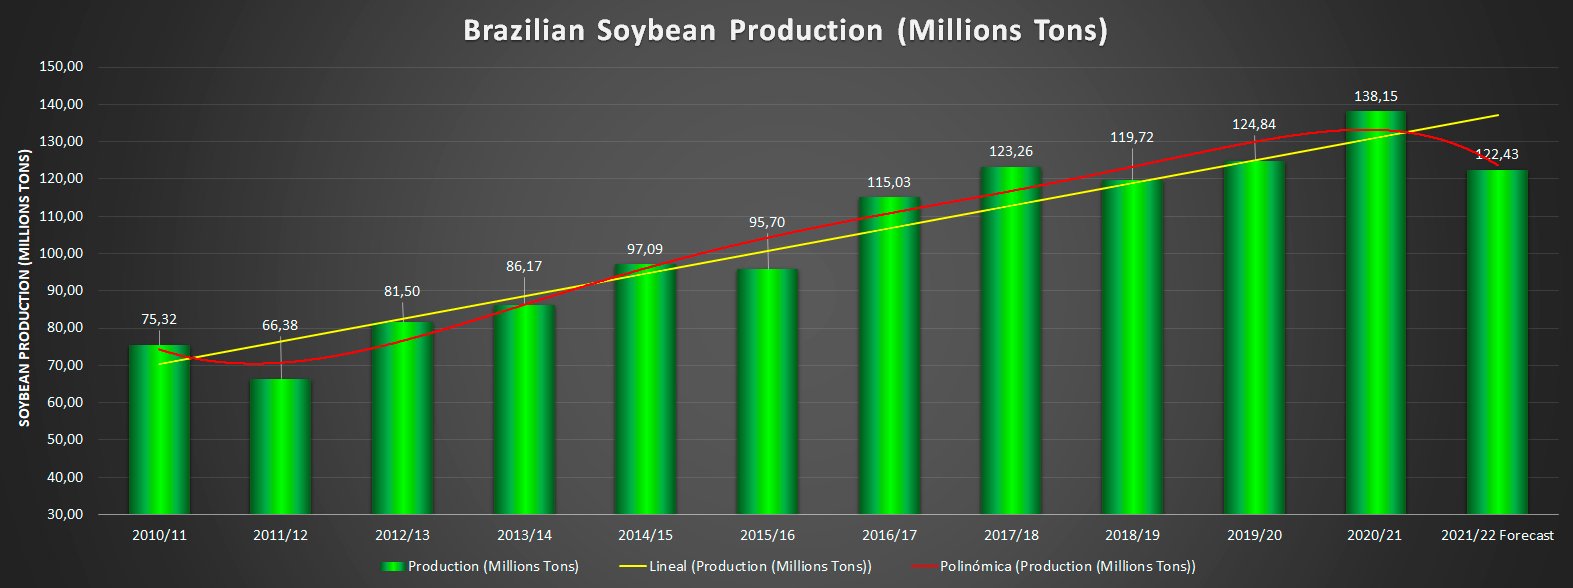
Campaign Status 2021/22 For the 2021/22 campaign, soybean production is forecast at 122.43 million tons, a reduction of 11.4% compared to the previous harvest (138.15 million tons). The good rainfall that occurred in practically the entire country helped in the recovery of a small portion of crops sown late in the South Region and in Mato Grosso do Sul, but did not reverse the decline in productivity, already announced in previous surveys.
Results of the last campaigns
Rio Grande do Sul remains the state most affected by the water deficit in November and December 2021, followed by Paraná and Mato Grosso do Sul. In the opposite scenario, most of the other states achieved higher yields than those obtained in the last harvest, with emphasis on Piauí, which has obtained 12.7% higher yields so far. Mato Grosso, Mato Grosso do Sul and Goiás are approaching the end of the harvest, surpassing more than 97% of the sown area.
Estimates indicate an average productivity of 3,000 kg/ha and a total production of 122.43 million tons, down 14.9% and 11.4%, respectively. The drop in production was not greater only due to the 4.1% increase in the sown area, reaching 40,804.9 million hectares in this harvest. For the 2021/22 harvest, there was a reduction in the estimated exports of 3.16 million tons, from 80.16 million tons to 77 million tons.
There was an increase in crushing of 3.57 million tons from 42.93 million tons to 46.50 million tons. The reduction in export estimates and the increase in domestic crushing are motivated by an expectation of lower soybean exports in the second half of the year, given that, with crushing margins very attractive, crushing and soybean oil exports should be high and, therefore, soy oil exports are now estimated at 1.56 million tons. As a result of the increase in the estimate of soybean crushing in grains and the reduction in the estimate of exports, the carryover stocks of soybeans in grains are estimated at 2.52 million tons by the end of 2022.
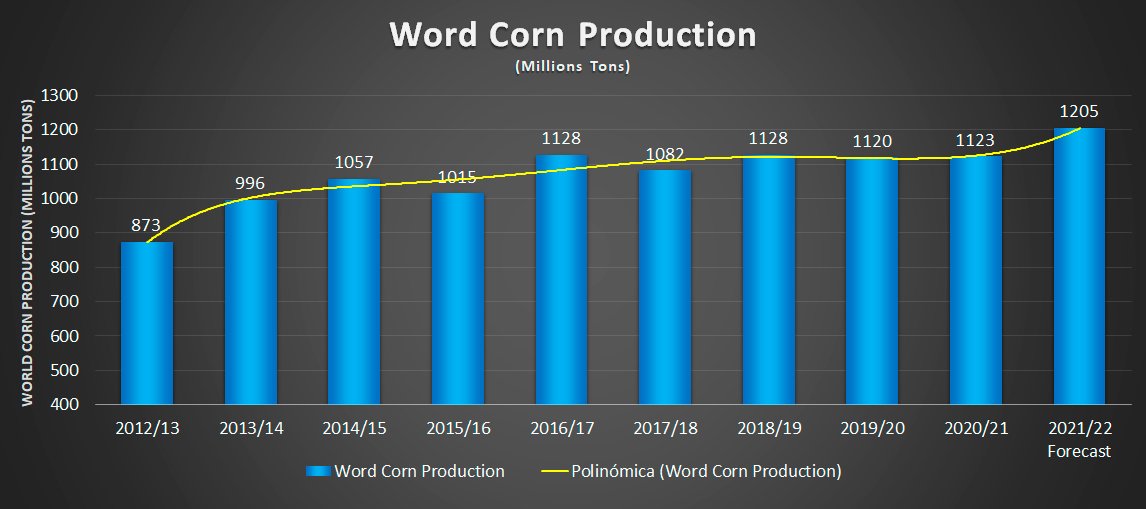
The United States Department of Agriculture (USDA) estimates that the World Corn Production 2021/2022 would be 1,205.45 million tons, about 4.31 million tons more than last month’s projection. The World Corn Production for the 2020/21 campaign was 1,125.88 million tons. The 1,205.45 million tons estimated for this year could mean an increase of 84.57 million tons or 7.51% in corn production around the world.
Evolution of World Corn Production
In 2022, corn prices are projected to drop by approximately 10% y/y due to an expected all-time record high global production, which is to reach 1.2B tonnes. This forecast is subject to a number of risks, such as volatile fertilizer and energy prices, high freight rates, biofuel policies and weather conditions.
Corn prices are forecast to ease in 2022 due to a sharp increase in global production. The world’s corn output is to soar by 7% y/y to a record 1.2B tonnes with higher crops in the U.S. and South America. Production in Brazil is expected to rise by 31% y/y to 114M tonnes, fully recovering from the last year’s 15%-drop caused by a drought. Argentine farmers are to harvest 54M tonnes of corn, 5% more than a year earlier. U.S. production will grow by 7% y/y to 384M tonnes.
Crop increases are also forecast in China, the E.U., Indonesia, Mexico, Nigeria, South Africa. Significant output growth is projected in Russia and Ukraine, where corn production is to rise by 8% y/y to 15M tonnes and by 39% y/y to 42M tonnes, respectively.
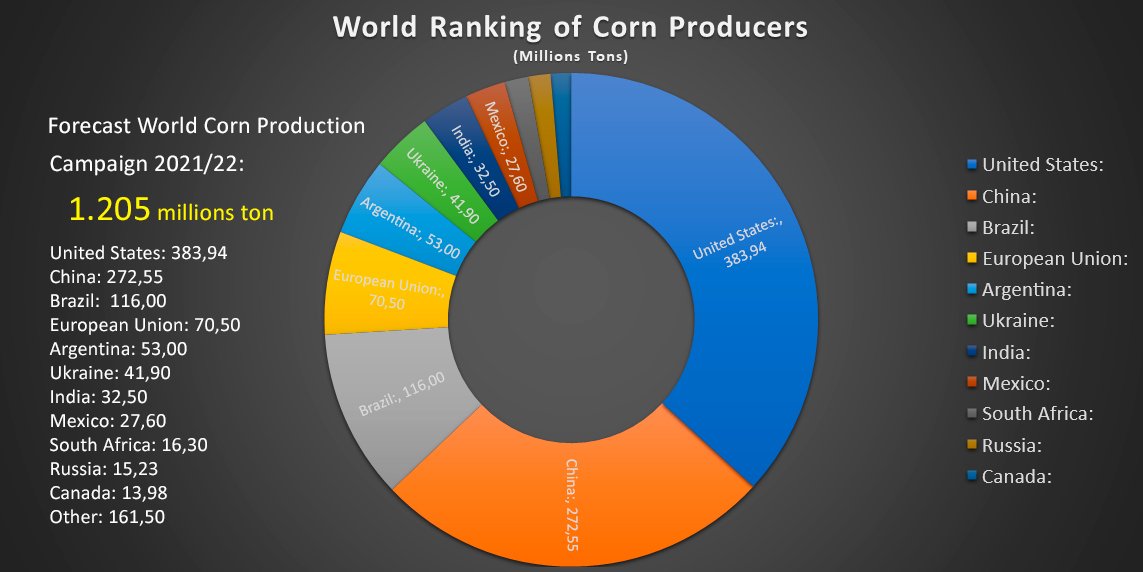
Ranking of the largest corn producers in the world
In 2021, Brazil has consolidated itself as the 3rd largest corn producer in the world, and Argentina is in the fifth position. Although Brazil and Argentina are still far from the first positions occupied by the United States and China, respectively, in 2021 both countries consolidated themselves as the third and fifth largest corn producers in the world, Brazil with production reaching 87 million tons, practically 20 million more than the European Union, occupying the fourth global position in corn production, and Argentina fifth position after the European Union with 50.5 million tons
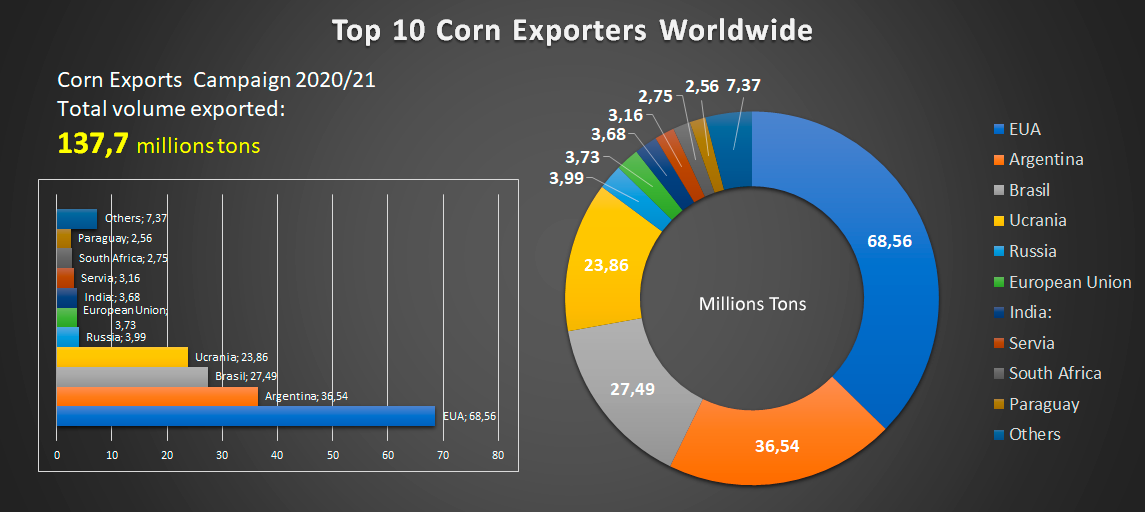
10 Largest Corn Exporters in the World
In the 2020/21 campaign, Argentina surpassed Brazil in exports and established itself as the second largest supplier worldwide, behind the United States. With exports of more than 40 Mt, Argentina supplied 22% of the world corn trade (185.8 Mt). In the 2021/22 business year, a significant growth in global corn trade is expected, amounting to 203.7 Mt, while local exports are estimated at 33.5 Mt, below what was exported in the previous campaign. Consequently, Argentina will lose market share this campaign, with an offer that will supply only 16% of international external demand. It is also expected that the country will once again rank as the third largest supplier of corn, surpassed by the United States and Brazil.
For its part, Brazil has consolidated itself as the 3rd largest corn exporter in the world, with 27.5 million tons of corn exported in 2021, which represents 32.5% of the total cereal produced in the country. This consolidated Brazil as the 3rd country that most exported corn in the last harvest, despite the damage caused by weather conditions in the 2nd corn harvest, which reduced exports by almost 20%, if compared to the 2019/20 harvest.
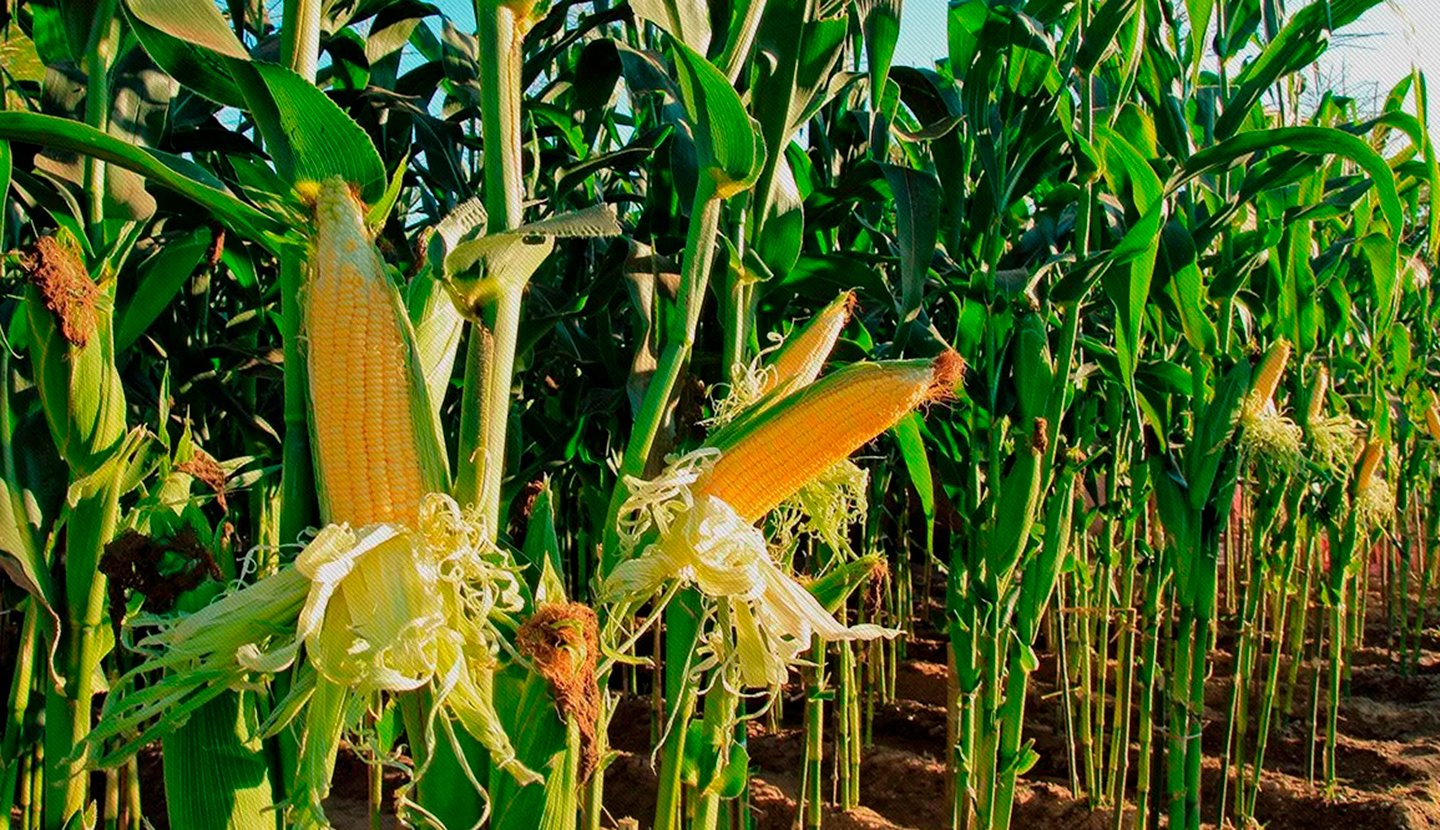
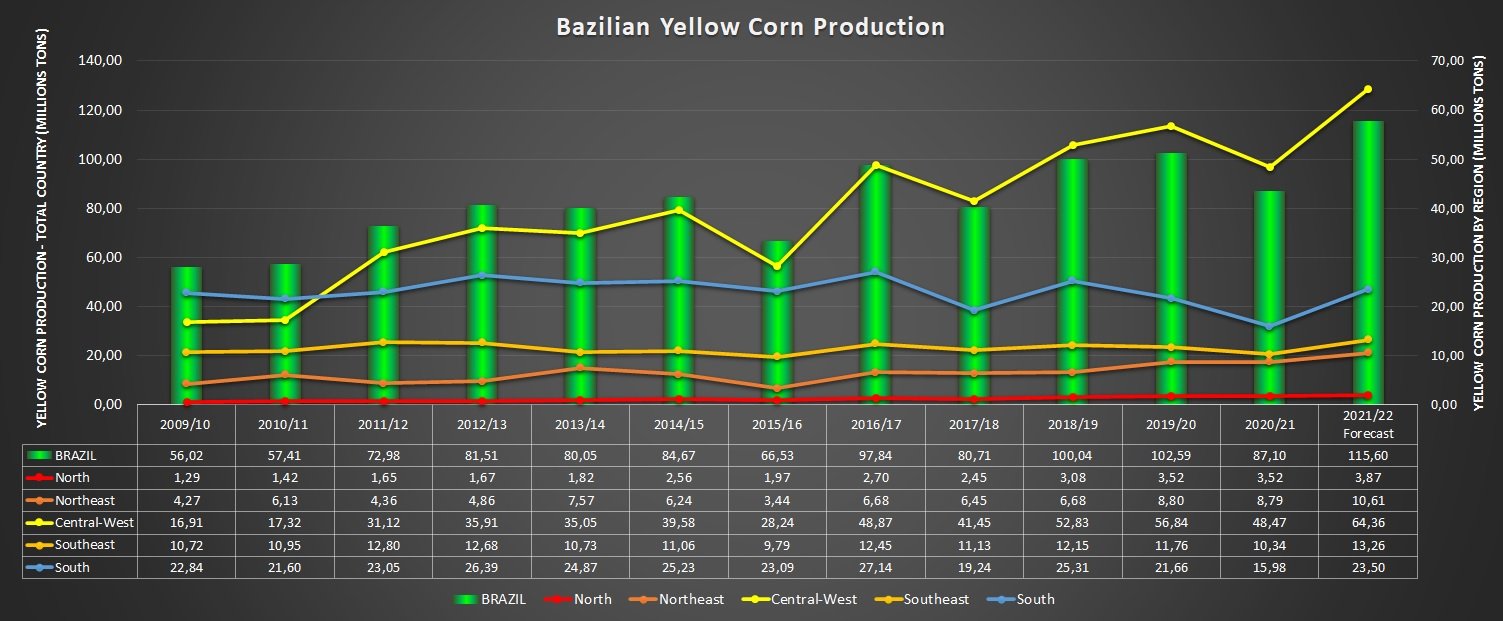
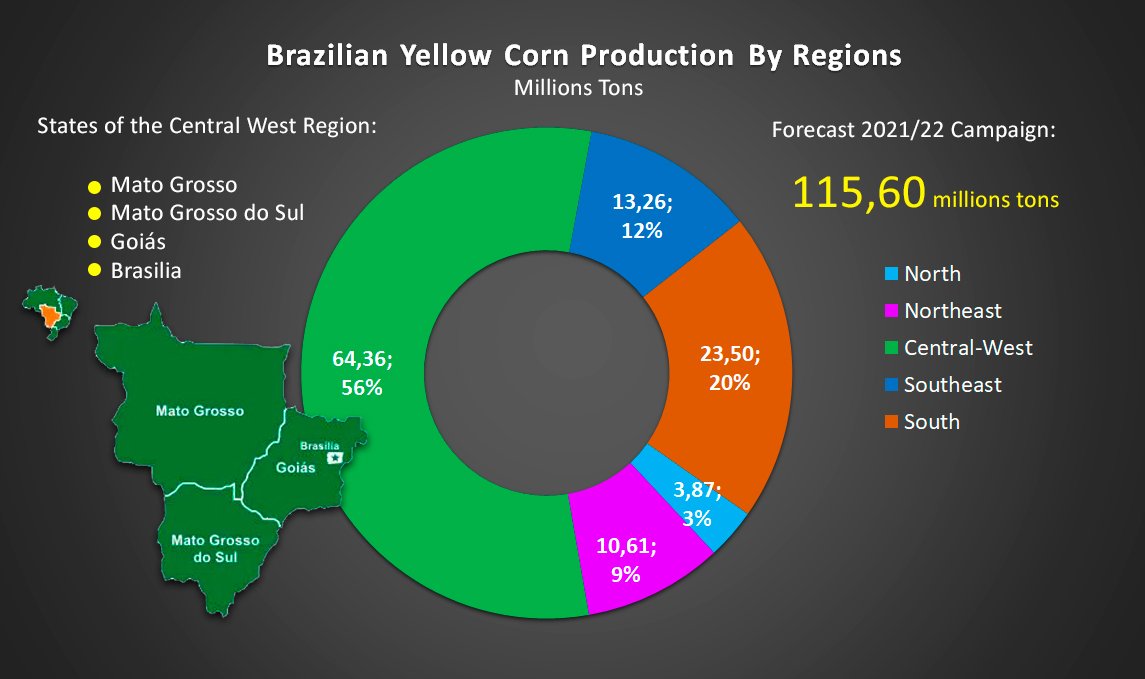
Brazilian Yellow Corn Production
Brazilian corn production is expected to total 115.602 million tons in the 2021/22 season, an increase of 32.7% compared to the previous season, when 87.096 million tons were harvested. After a sharp drop in production in 2021, as a result of the delay in planting the 2nd crop and the lack of rain in the main producing Federation Units, a year within normality is expected, which will allow for the recovery of crops, even reaching a new national record. With an area of 21.238 million hectares sown, it represents an increase of 6.5% over the previous year. Productivity is estimated at 5,443 kilograms per hectare, a gain of 24.6% over the previous season, of 4,367 kilograms per hectare.
Results of the last campaigns
For corn 1st crop, the estimate is for a production of 24.7 million tons, a decline of 3.8% compared to the previous month and 3.9% compared to the 2021 crop, despite the increase of 6, 9% in the area to be harvested. The average yield, on the other hand, shows a reduction of 10.1%. Although the rains arrived early in most of the country, starting the agricultural year at the right time, from the second half of the crop cycle onwards, there was a lack of rain in the South Region, which considerably reduced the production potential of this crop.
For corn 2nd crop, production is estimated at 87.2 million tons, an increase of 4.9% compared to the previous month and 40.4% compared to 2021, with growth of 6.8% in the area planted.
Climate impact
In the 2021 harvest, in most of the Federation Units that are important in the production of the cereal, the weather hampered the development of the second harvest crops. In addition, the agricultural year was delayed, shortening its “planting window”, which also helped to reduce production, as it left the crops more exposed to rainfall restrictions during the production cycle. For 2022, a more beneficial climate situation is expected for the second corn crop, when compared to 2021. The agricultural year was not delayed and soy planting was carried out, for the most part, at the ideal time, which favored the “planting window” for second crop corn. Production growth is expected in the main producing states.
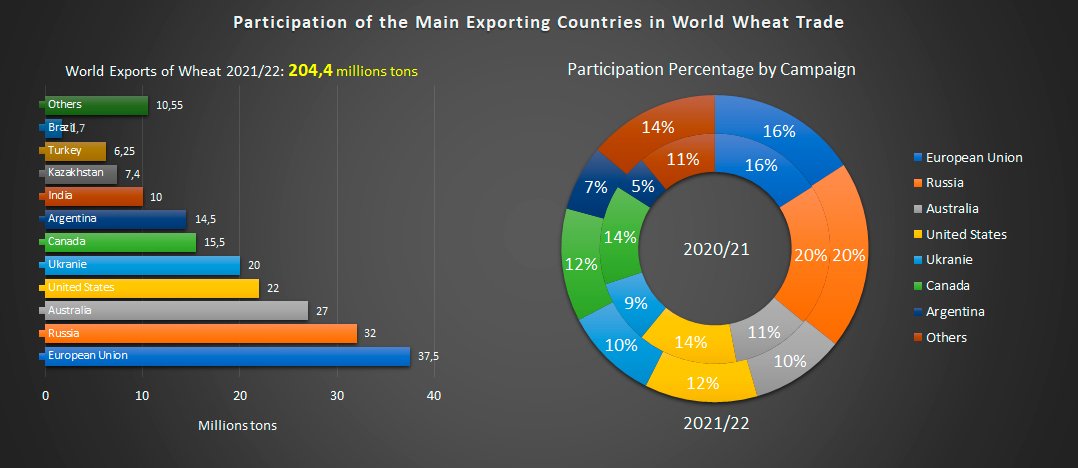
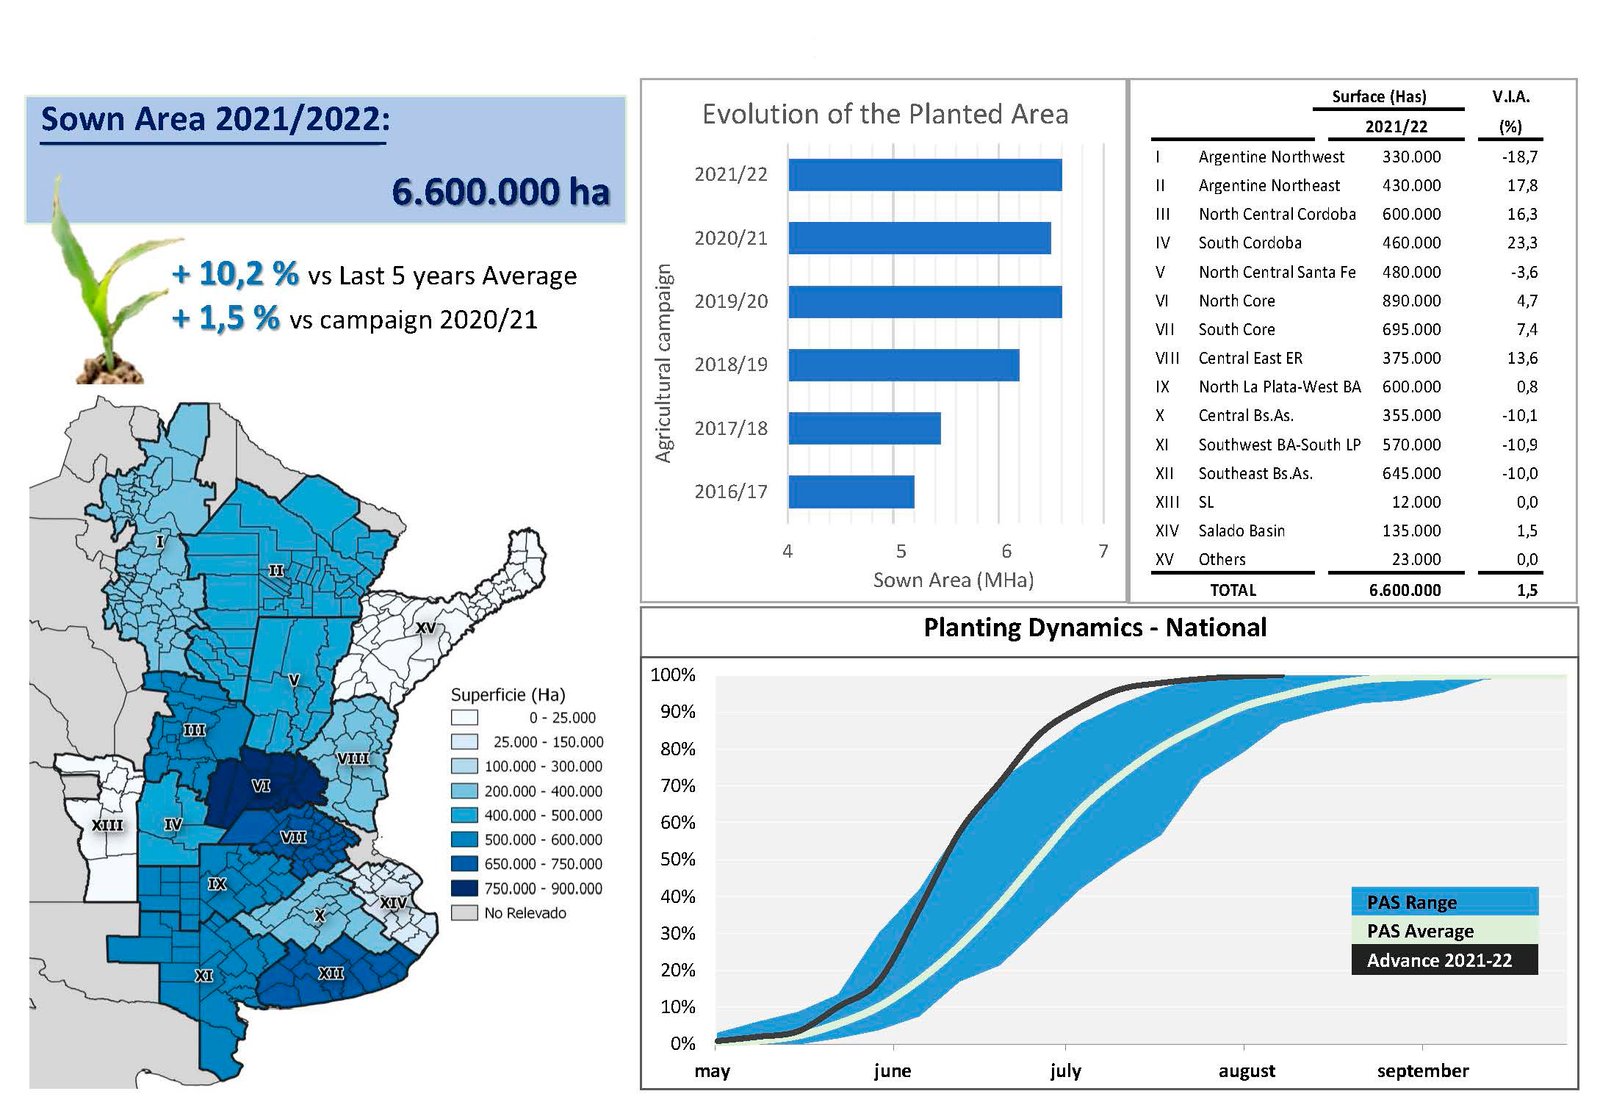
We mainly market wheat from Argentina, but we also have wheat from Brazil, Russia and Ukraie. Currently, the wheat region of Argentina is located in the Pampean region and is divided into seven ecological subregions according to local climate and soil characteristics. The subregions are called: Ecological Subregion of Wheat I, II north, II south, III, IV, V north and V south. This wide region has a temperate climate, with two well differentiated areas: one humid, with an average of 800 millimeters per year, and another semi-arid, with 600 millimeters.
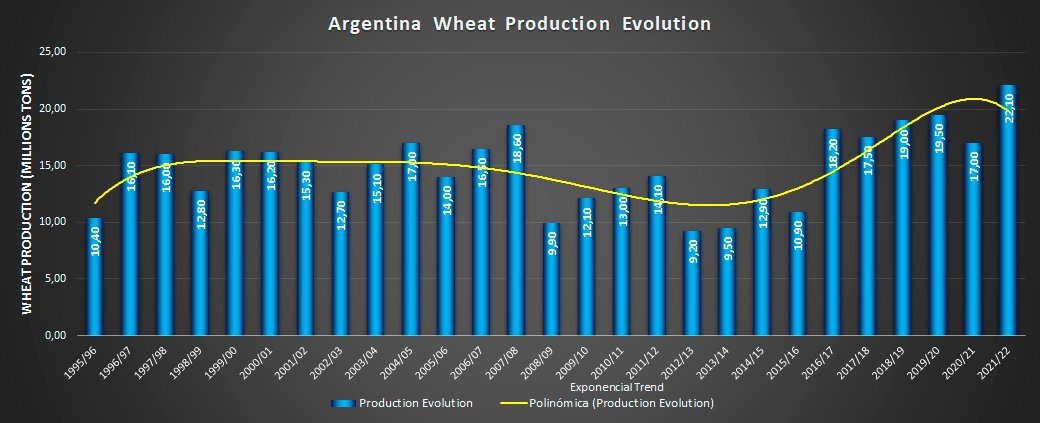
According to the latest calculation of the “Bolsa de Comercio de Rosario”, wheat exceeds all expectations, between November and December 2021 the estimates went from 20.4 to 22.1 million tons. In the penultimate month of the year, the main winter cereal left behind the effects of the heat and lack of water in October. That monthly jump of 1.7 Mt seemed unthinkable, but it is happening, they point out. From the Rosario entity they underline that it will be the highest production in history, encouraged by “a leap in the level of technology that reached the small producer”. Until now, the largest Argentine production was that of 2019/20 with 19.5 million tons. Compared to last year, which registered 17 million tons, there will be 30% more wheat.
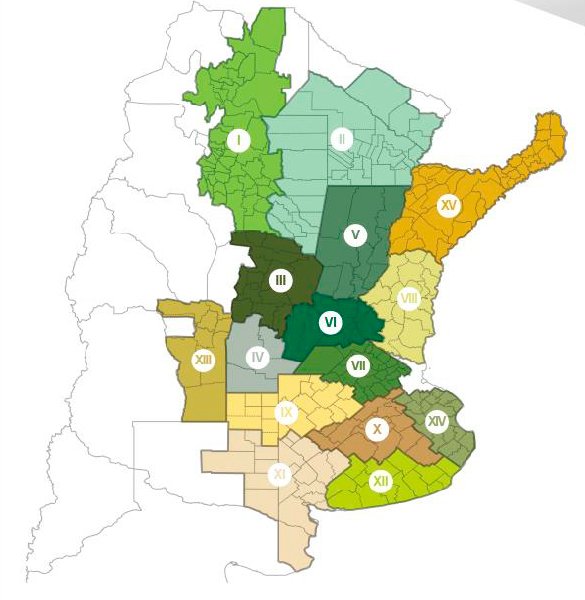
Argentine Wheat Growing Regions
I – NOA – Noroeste Argentino (Northwest Argentina)
II – NEA – Noreste Argentino (Northeast Argentina)
III – Centro-Norte de Córdoba (Center-North of Córdoba)
IV – Sur de Córdoba (South of Córdoba)
V – Centro-Norte de Santa Fe (North Central Santa Fe)
VI – Núcleo Norte (North Core)
VII – Núcleo Sur (South Core)
VIII – Centro-Este de Entre Ríos (Center-East of Entre Ríos)
IX – Norte de La Pampa – Oeste de Buenos Aires (North of La Pampa – West of Buenos Aires)
X – Centro de Buenos Aires (Downtown Buenos Aires)
XI – Sudoeste de Buenos Aires – Sur de La Pampa (Southwest of Buenos Aires – South of La Pampa)
XII – Sudeste de Buenos Aires (Southeast of Buenos Aires)
XIII – San Luis (San Luis)
XIV – Cuenca del Río Salado (Salt River Basin)
XV – Corrientes – Misiones (Corrientes – Misiones)
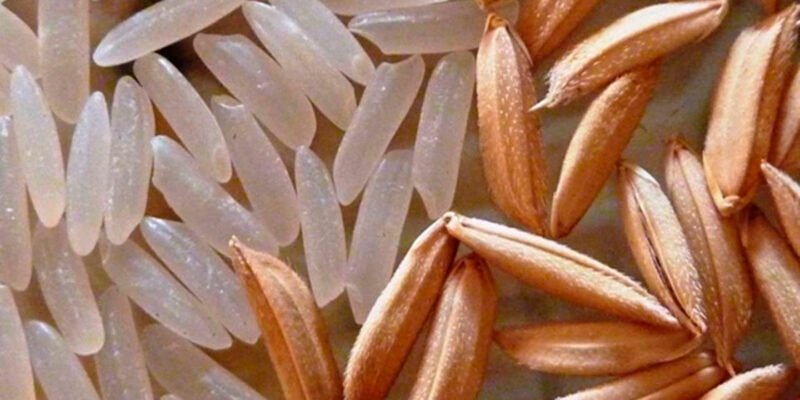
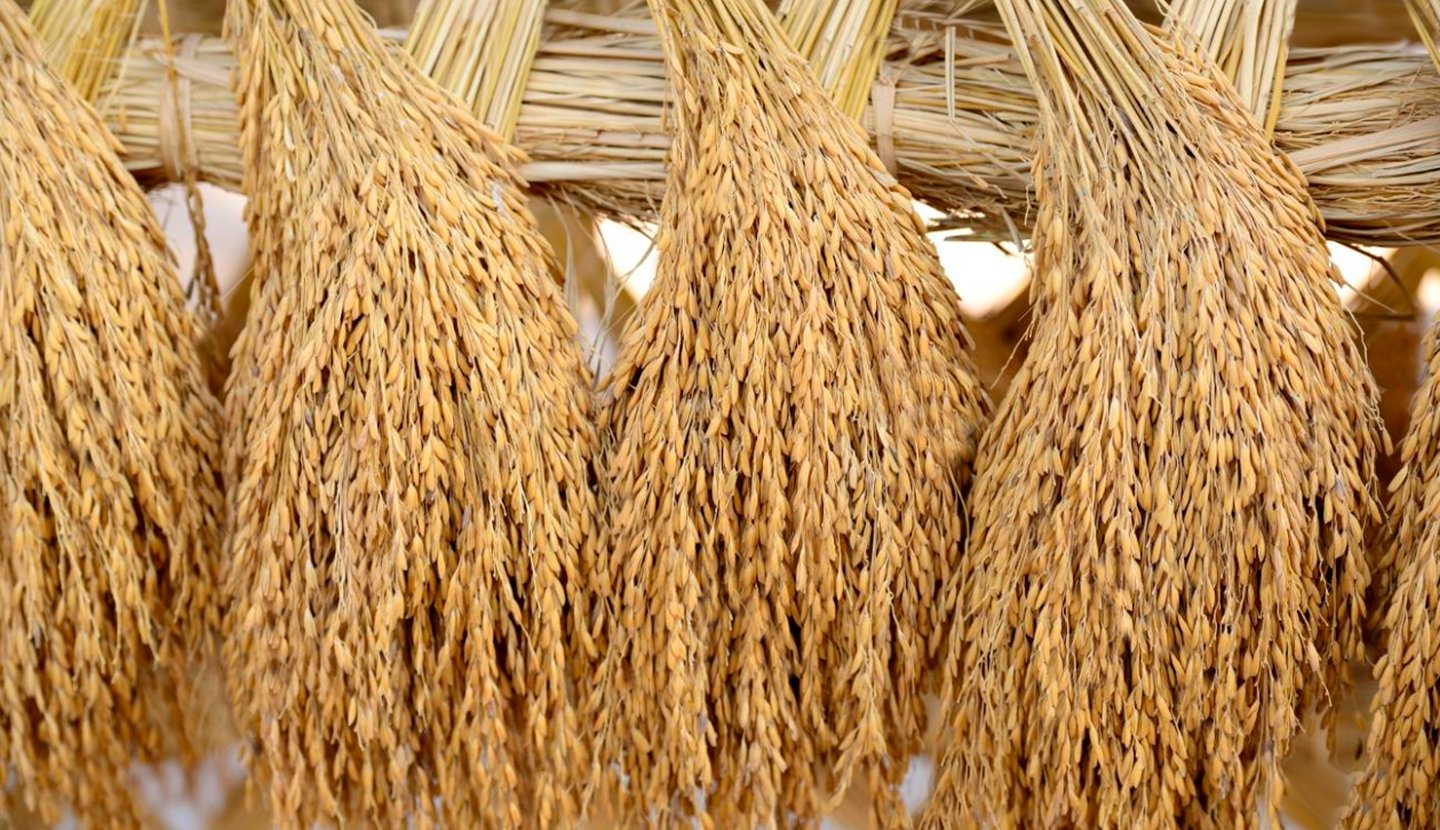
Rice is grown on all continents, with Asia as its main crop, with 90% of world production. This is followed by the American, with 5.1%, the African, with 4.2%, the European, 0.6% and the oceanic, also with 0.1% of world rice production. In Oceania, Australia stands out, which alone produces 819.3 thousand tons.
Rice in Asia
In Asia, there are the world’s eight largest rice producers. First is China, followed by India, Indonesia, Bangladesh, Vietnam, Thailand, Myanmar and the Philippines, which produce 207, 157, 70, 52, 45, 33, 26 and 19 million tonnes respectively. China contributes 28% of world production and 31% of Asia, followed by India with 21% and 24%, respectively. Brazil is in 9th place, with a production corresponding to 1.6% of the world.
Rice in America
In the Americas, rice is of great social and economic importance. In Latin America and the Caribbean, production of 28.7 million tons of rice represents 3.9% of world production, especially Brazil, which accounts for 42% of this production. In North America, rice is produced only in the United States of America, whose production is 10.1 million tonnes.
Rice In the Southern Cone
In the Southern Cone Market (Mercosur), the highlight is Brazil, which occupies the 1st place in harvested area and rice production, with 10.8 million tons, followed in descending order by Peru, 2.9 Colombia, 2.2, Argentina, 1.6, Ecuador, 1.4, Uruguay, 1.3, Paraguay, 0.8, Bolivia, 0.4 and Chile, 0.1. The rice area in these countries totaled 4.5 million hectares, with a production of 24.1 million tons, corresponding to 2.8% and 3.3% of the world’s total, respectively, and one productivity of 5,262 kg ha-1.
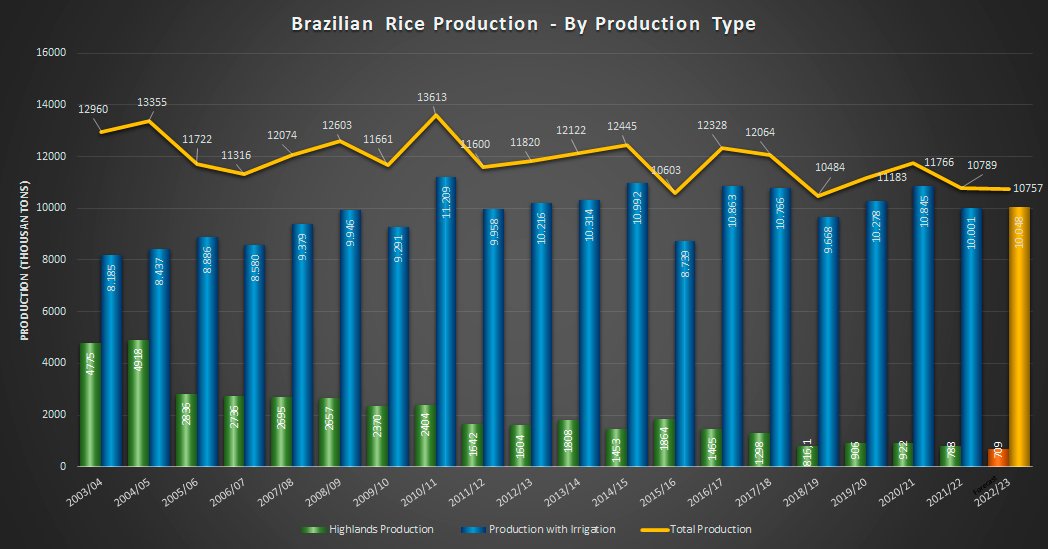
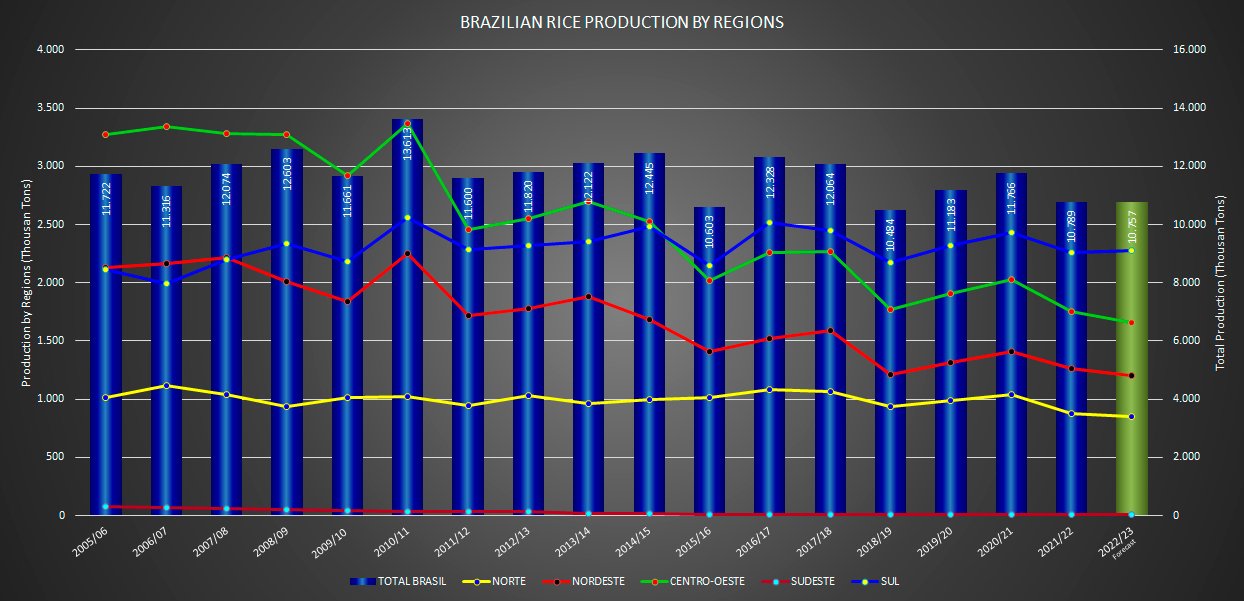
According to Embrapa Rice and Kidney Bean (2021), with adapted and modified data from the monitoring of crops from the Agricultural Systematic Survey (LSPA) of the Brazilian Institute of Statistical Geography (IBGE), in the agricultural year of 2021, total rice production was 10,8 million tonnes.
The irrigated rice cultivation system, with controlled irrigation, accounted for 88.2% of the total national production, followed by highland rice, 11.8%, and irrigated rice, without controlled irrigation or natural floodplain. ,1%.